
This exploration of five years of air quality data suggests that atmospheric stagnation plays a crucial role in the National Capital’s winter air pollution crisis.
“It was the best of times; it was the worst of times…”
Charles Dickens may have been writing about London and Paris, but the opening line of A Tale of Two Cities feels strikingly relevant to the atmospheric reality of the National Capital Territory (NCT) of Delhi.
Public discourse often treats Delhi’s pollution as a singular, year-round struggle. However, this independent analysis of data from 2019 to 2025 suggests a different narrative. The data indicates that the capital oscillates between two distinct atmospheric regimes separated by the seasons. Central to this exploration is PM2.5 (particulate matter < 2.5 microns), the primary metric for air toxicity and the leading environmental risk factor for morbidity in the region.
The following visualizations explore the story of those “two cities.”
Chapter 1: The City of Scarcity (2025)
Beginning with the current year, the data highlights how scarce “good” air days have become.
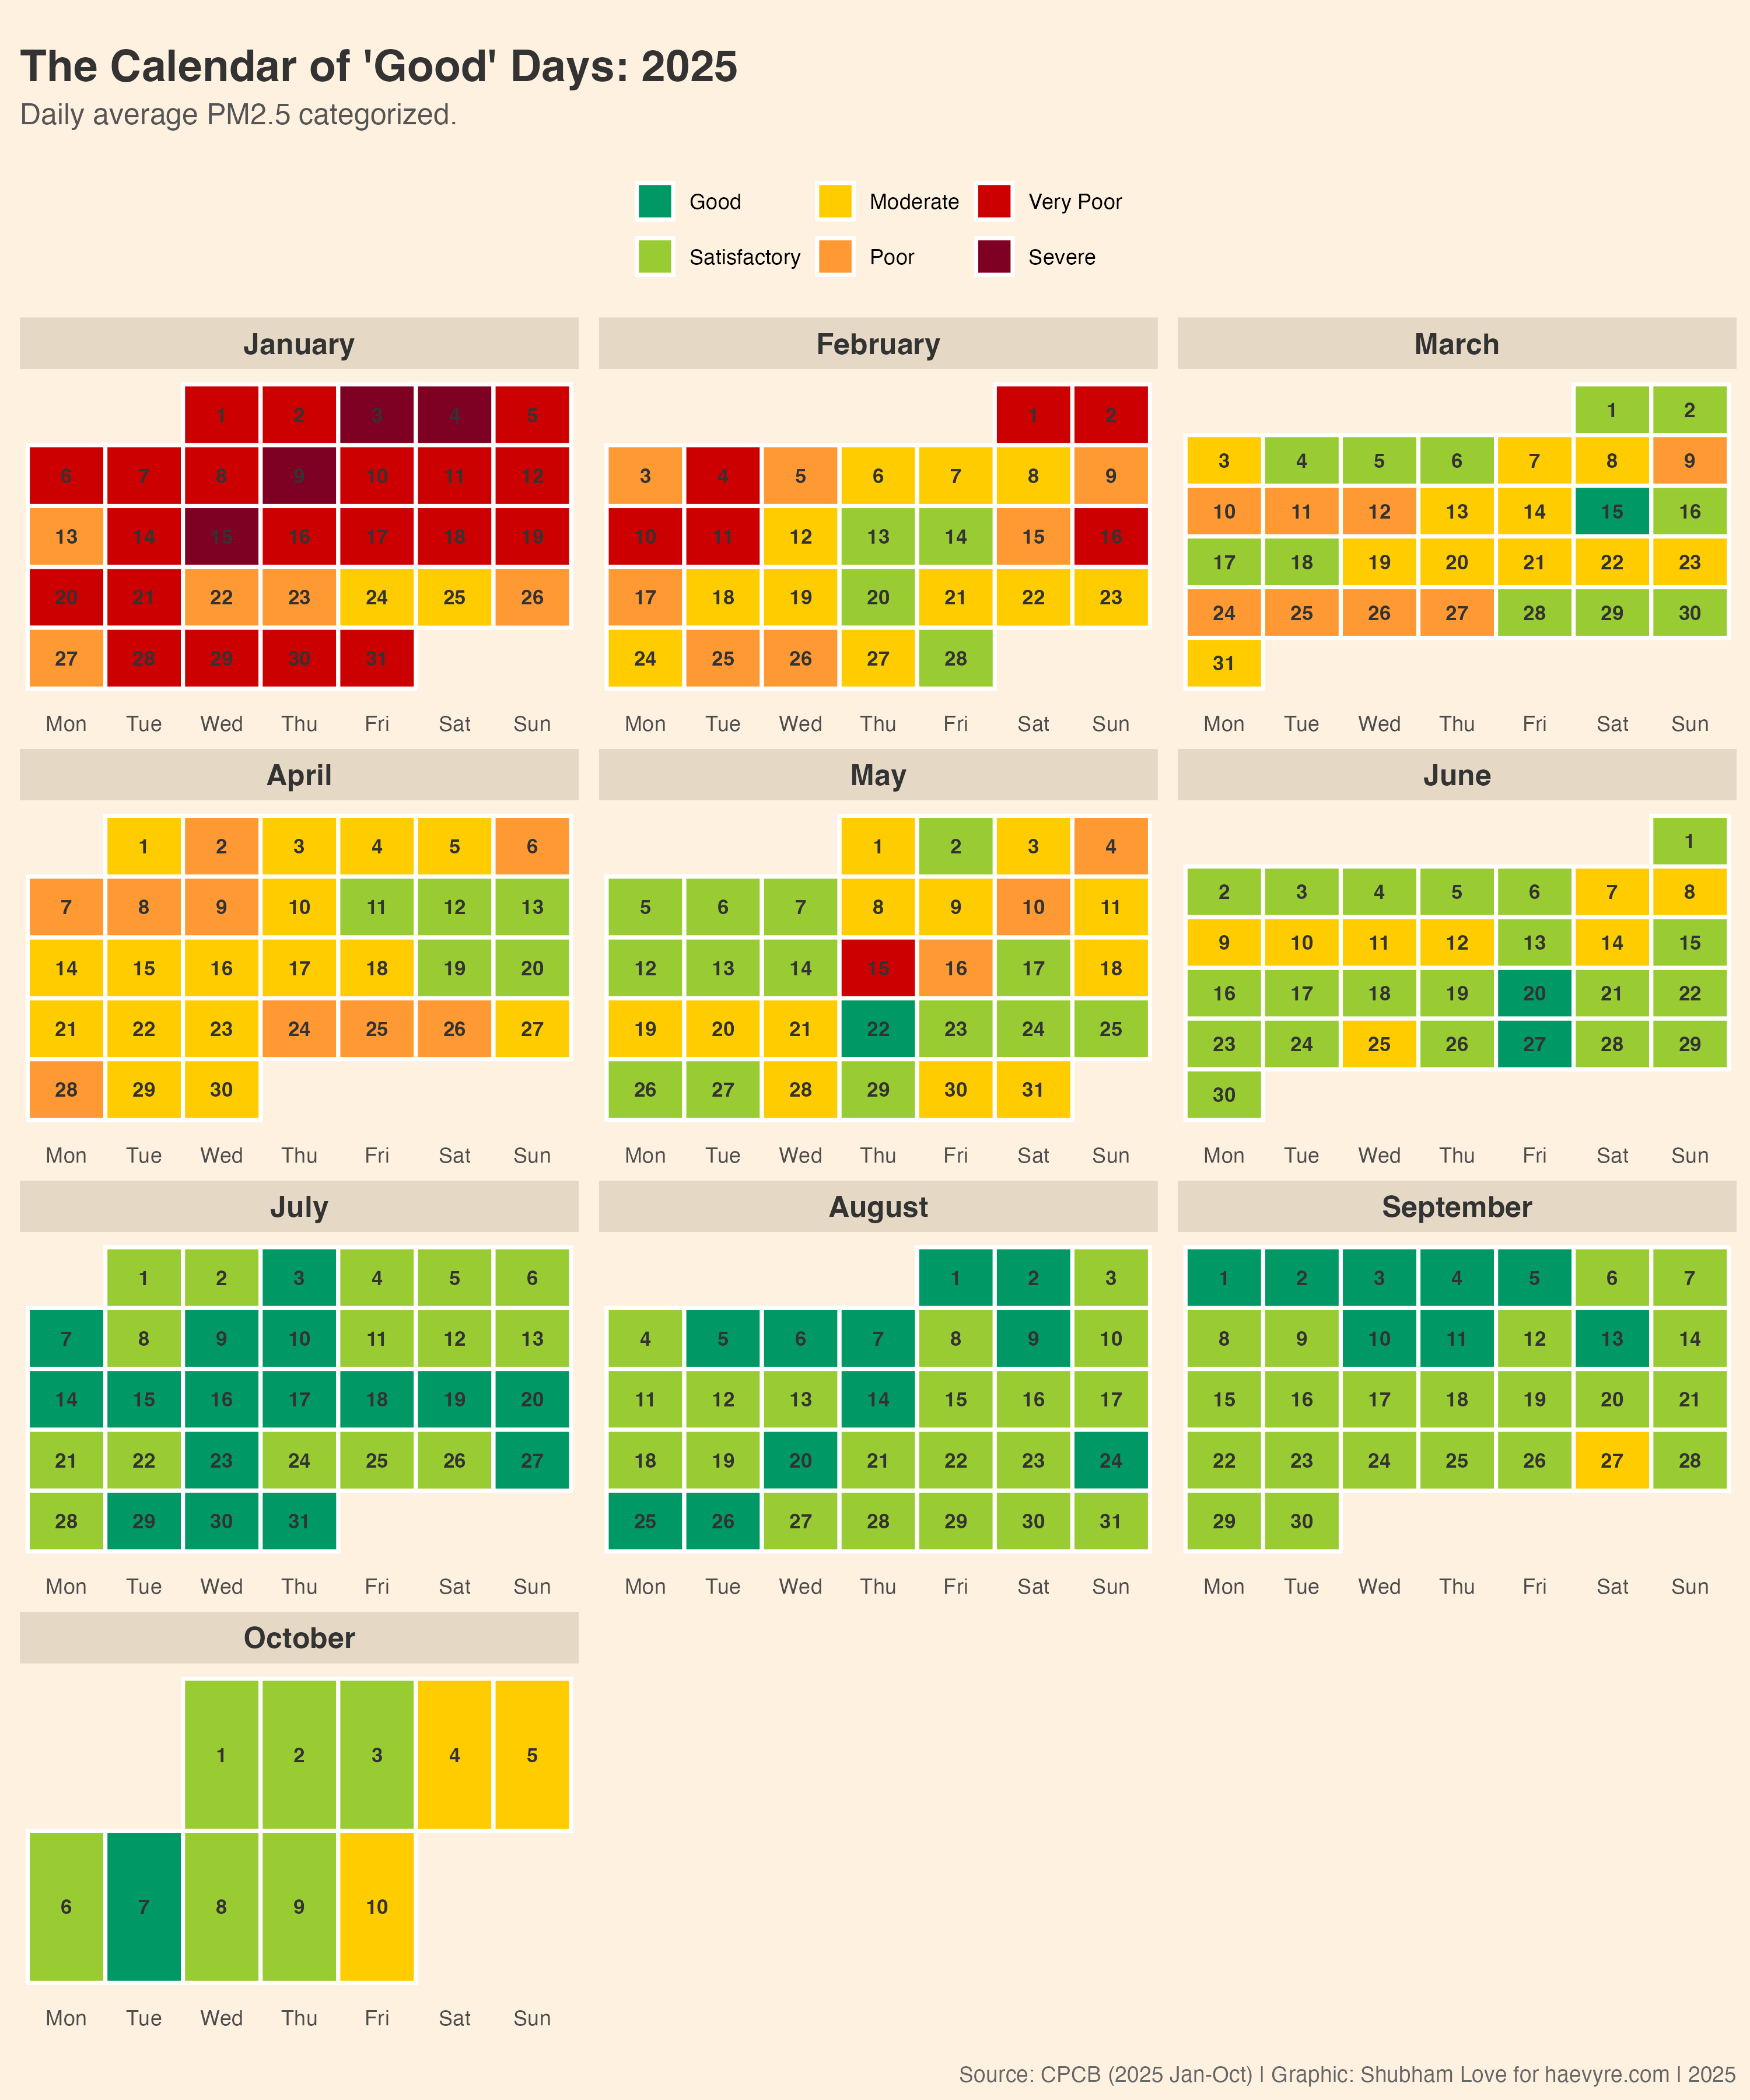
As depicted in Figure 1, days meeting the “Satisfactory” or “Good” standards appear infrequently in the dataset. The dominance of red and yellow hues illustrates the challenge residents face in accessing clean air outside of the monsoon season.
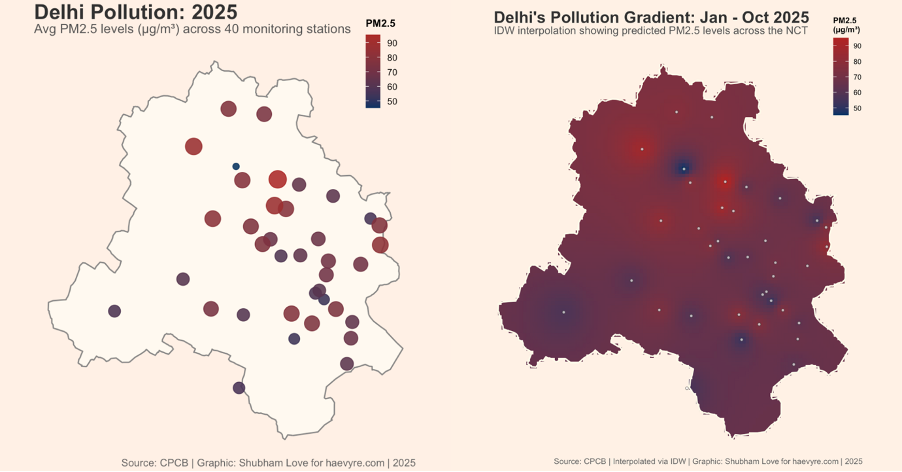
Even within the NCT, the data shows spatial variation. Figure 2 illustrates average PM2.5 concentrations across 40 monitoring stations, highlighting that while some areas experience lower relative averages, high pollution exposure is widespread across the region.
Chapter 2: The Divide (The ‘U’ Curve)
How does the transition between these two atmospheric states occur? The historical trend lines show a consistent seasonal pattern.

The multi-year analysis reveals a distinct “U-shape”. Pollution levels tend to slide from winter highs down to monsoon lows (July–August), before rising sharply beginning in October.
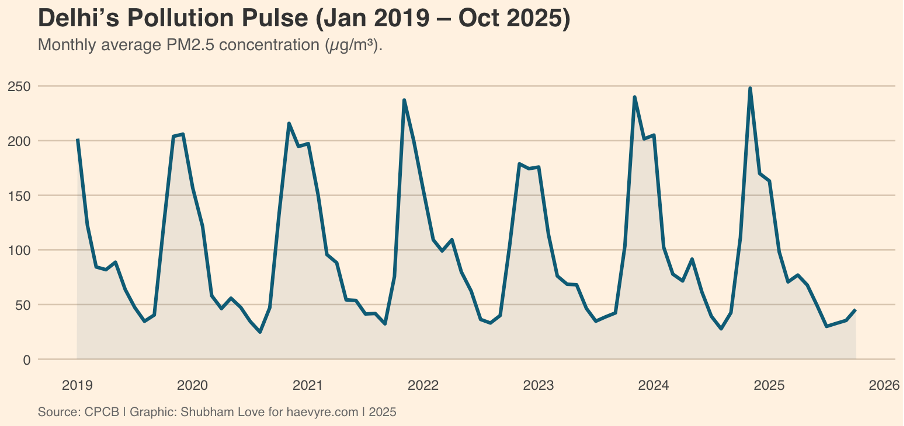
This recurring cycle suggests that seasonal geography and meteorology are significant structural factors in the crisis.
To understand the persistence of the air pollution problem, the analysis looks at the annual pollution distributions. A clear trend across the years emerges. Figure 5 stacks the PM2.5 for each year from 2019 to 2025. What is striking is the consistency of the “shape” of Delhi’s air.
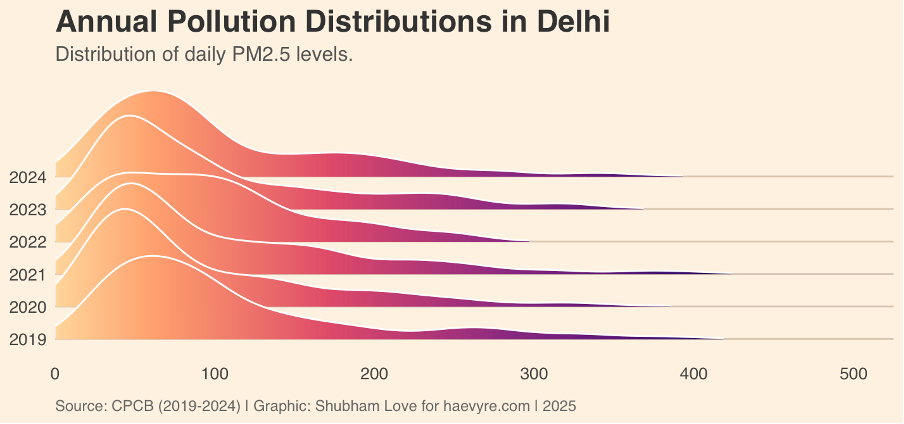
Despite policy interventions and varying weather patterns, every year exhibits the same statistical deformity: a major “peak” in the Moderate/Poor range and a long, flat “tail” extending into the Very Poor/Severe category (>250 µg/m³). The data suggests that while the peak height of the curve may fluctuate slightly, the underlying distribution of pollution remains stubbornly fixed. The capital has not yet managed to shift the curve to the left (towards cleaner air); it is merely oscillating within the same toxic bracket.
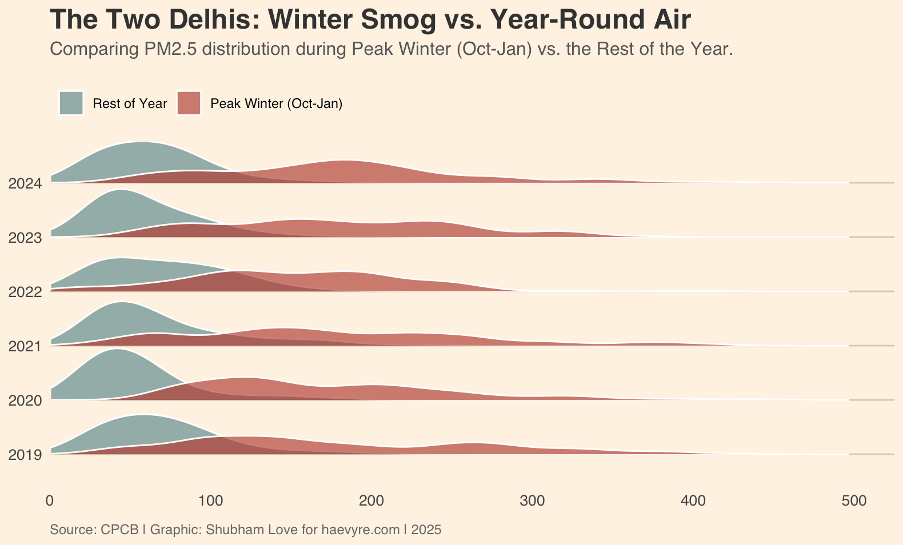
The “Tale of Two Cities” metaphor becomes increasingly clear when PM2.5 distributions across the year are separated into winter and the rest of the year. The trend of the two curves that barely overlap indicates that the “Winter City” does not simply have more pollution than the summer; it effectively possesses a different atmosphere entirely.
In statistical terms, the air quality is bimodal – it has two stable states. Delhi does not slide gradually from good to bad; it shifts gears into a different meteorological reality where the air composition is fundamentally altered.
Chapter 3: The Missing Half of the Equation
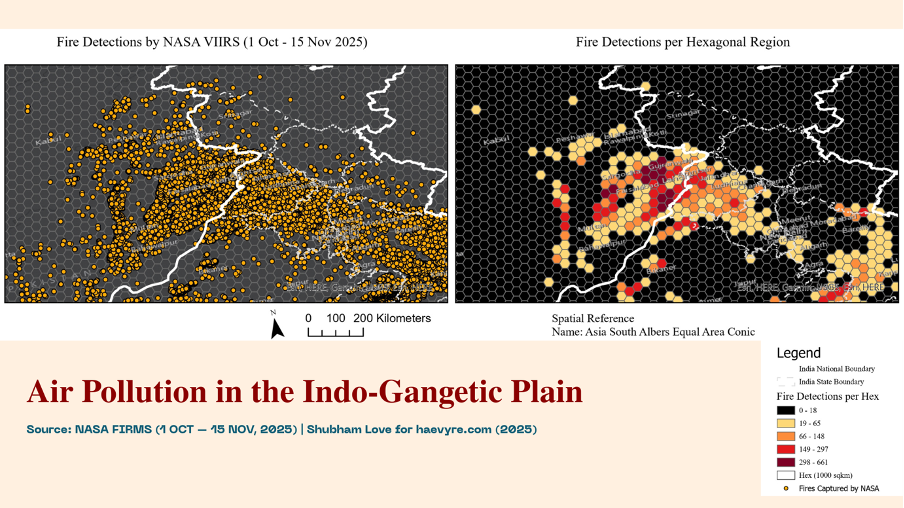
A common focal point in air pollution discussions is the contribution of external emission sources, such as stubble burning, during the onset of winter. Figure 7 makes the regional scale of the problem undeniable. The dense cluster of red hotspots is not limited to the Indian states of Punjab and Haryana; it extends seamlessly across the whole Indo-Gangetic Plain.
However, the presence of smoke is only half the story. If emissions were the sole driver, pollution would dissipate as soon as the fires went out. But it doesn’t. This brings the analysis to a critical meteorological factor often overshadowed by emission sources: atmospheric stagnation. While agricultural fires contribute significantly to the particulate load, the persistence of this smoke within the capital can largely be attributed to the city’s reduced ventilation capacity.

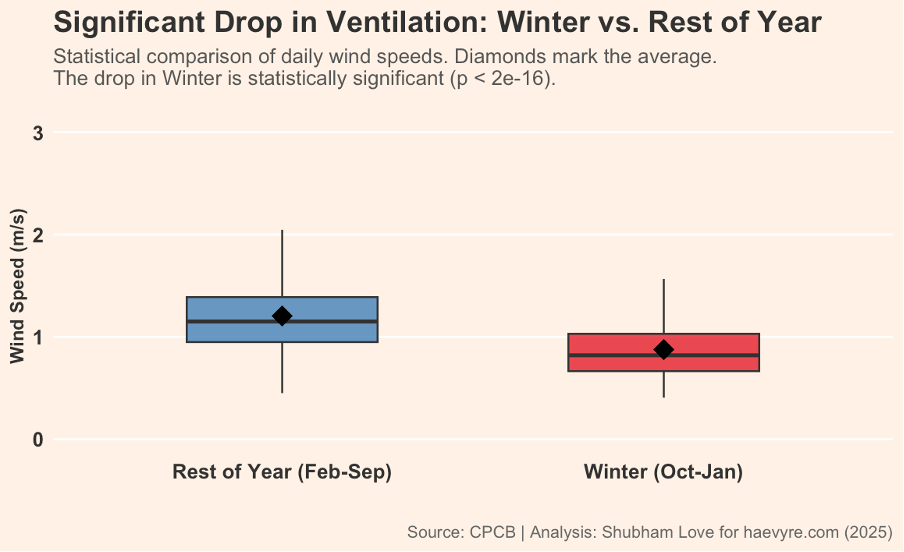
The boxplots in Figure 8 illustrate this collapse in ventilation. In September, the city experiences relatively higher median wind speeds (indicated by the teal box). However, the transition into October marks a distinct meteorological shift, with the average wind speeds dropping significantly. The analysis shows a statistically significant decline (Figure 9) in wind speeds during the winter months of October to January compared to the rest of the year.
Statistical Evidence: The Ventilation Trap
To determine whether this reduction in wind speed is a primary driver of pollution spikes, a linear regression model was used to compare wind speed against PM2.5 levels.
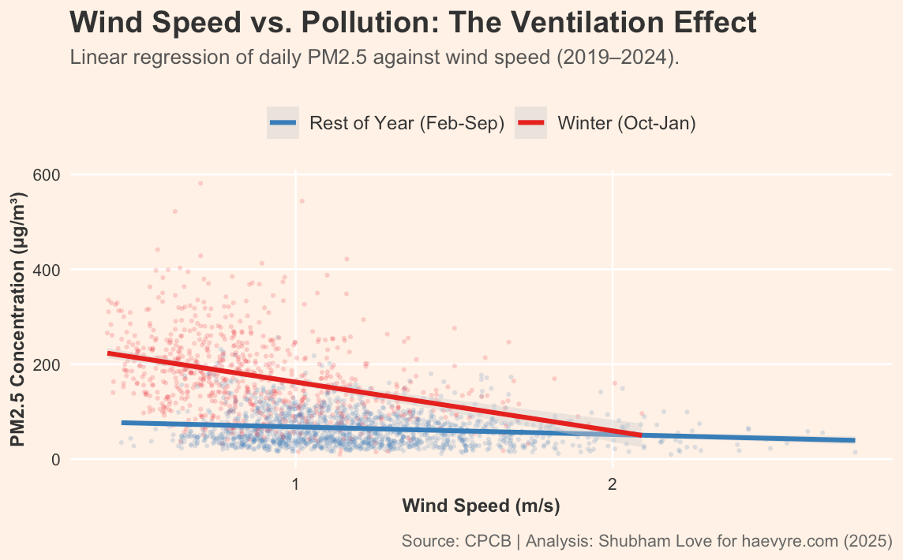
The results indicate a stark contrast between seasons. During the rest of the year (blue line), wind speed shows a weak correlation with pollution levels – air quality remains generally stable regardless of wind variance. In winter (red line), however, the relationship becomes aggressive. The steep slope suggests that even a minor increase in mean daily wind speed (1 m/s) correlates with a reduction in mean daily pollution levels of over 100 µg/m³.
This indicates that the “Winter City” is highly dependent on ventilation. When wind speeds fail, as Figures 8 and 9 show is common, the region effectively loses its capacity to disperse pollutants, leading to rapid accumulation.
Chapter 4: The Source vs. The Trap
This leads to a critical question regarding the origin of the pollution: is the dominant factor transboundary smoke blown in from regional fires, or is it local pollution trapped by calm air?
An analysis of wind direction and velocity provides insight. To answer this, the analysis zoomed in on high-resolution meteorological data (15-minute intervals) for the winter of 2024 to generate a “fingerprint” of the airflow.

Public discourse frequently attributes Delhi’s winter peaks primarily to smoke transport from the North-West (Punjab/Haryana). However, the 2024 data presents a conflicting reality regarding the whole season. The wind flowed from the North-West sector only 9.8% of the time. In contrast, the dominant airflow during winter comes from the South (S) and South-West (SW), which combined account for 35.8% of the period.
This uniformity in PM2.5 levels (ranging tightly between 176 and 199 µg/m³ across all directional sectors) suggests that the city is not merely being invaded by a specific directional plume. Instead, the entire regional airshed appears saturated. The pollution is widespread because the air is moving nowhere.
| Wind Speed Category | Mean PM2.5 | Count | Frequency (%) |
| Breezy (>3 m/s) | 150.5 | 4887 | 1.7 |
| Light (1-3 m/s) | 170.7 | 76869 | 26.5 |
| Calm (<1 m/s) | 197.8 | 207875 | 71.8 |
If the direction does not explain the severity of the crisis, the wind speed does. The Polar Plot analysis (Right, Figure 11, and Table 1) reveals that the crisis is driven by the sheer frequency of stagnation.
For 71.8% of the winter, wind speeds remained below 1 m/s (Calm). During these vast stretches of stillness, PM2.5 levels averaged 198 µg/m³. Conditions capable of effectively flushing the airshed (speeds > 3 m/s) occurred only 1.7% of the time. Even during these rare breezy moments, pollution levels remained elevated (151 µg/m³), but the reduction confirms that ventilation may be the only effective cleaning mechanism available to the NCT.
Chapter 5: The Daily Rhythm
Finally, the analysis examines the temporal dynamics at an hourly scale to understand how this entrapment manifests over a 24-hour cycle.

The daily profile reveals the rhythm of the winter stagnation. Pollution levels build up aggressively overnight as temperatures drop and the air settles. The primary window of relief appears between 12 PM and 4 PM, where the curve shows a visible decline.
This dip is consistent with the breaking of the inversion layer. As the afternoon sun warms the ground, vertical mixing increases, allowing the city to temporarily ventilate. It represents a brief window of dispersion before sunset, when the atmospheric lid lowers once again and the “Stagnation Trap” described in Chapter 4 resumes.
Conclusion
The data suggests that the “Tale of Two Cities” metaphor is more than just that; it reflects the reality of the NCT and the people who inhabit it. Delhi oscillates between a ventilated summer metropolis and a stagnant winter airshed.
The 2024 case study provides definitive evidence for the “Stagnation Hypothesis.” The data indicates that Delhi’s winter air crisis is defined by a meteorological lockdown: for nearly three-quarters of the season (71.8%), the atmosphere is essentially paralyzed, trapping local and regional emissions in a dense, breathable smog.
Acknowledging this duality is the prerequisite for effective intervention. While curbing episodic sources like regional farm fires is critical, we must accept a hard truth: the meteorological constraints cannot be legislated. The wind will not move simply because we command it.
Consequently, the policy focus must expand beyond managing winter spikes to aggressively collapsing the baseline pollution load year-round. Reducing base emissions during the ventilated months is the only way to create the necessary “atmospheric headroom” for when the ventilation fails. The findings imply that Delhi’s winter policy must be designed for an atmosphere with near-zero dispersive capacity. Ultimately, the solution lies not just in fighting the smoke of November, but in enforcing a year-long structural discipline that adapts to the unyielding physics of the region.
Note to Readers: This article presents an independent exploratory analysis of public air quality data sourced from the Central Pollution Control Board (CPCB). The visualizations and statistical models used here are simplified representations intended to give the general reader an appreciation of the broad structural mechanics driving Delhi's smog. This work is done with the best of intent and knowledge but does not claim the rigor of peer-reviewed academic literature, nor should it substitute for official government reports or policy frameworks. Complex atmospheric dynamics involve variables beyond the scope of this analysis, and readers are encouraged to consult the extensive body of rigorous scientific studies that exist on this subject for a more granular understanding. All data was sourced from airquality.cpcb.gov.in.
Leave a comment